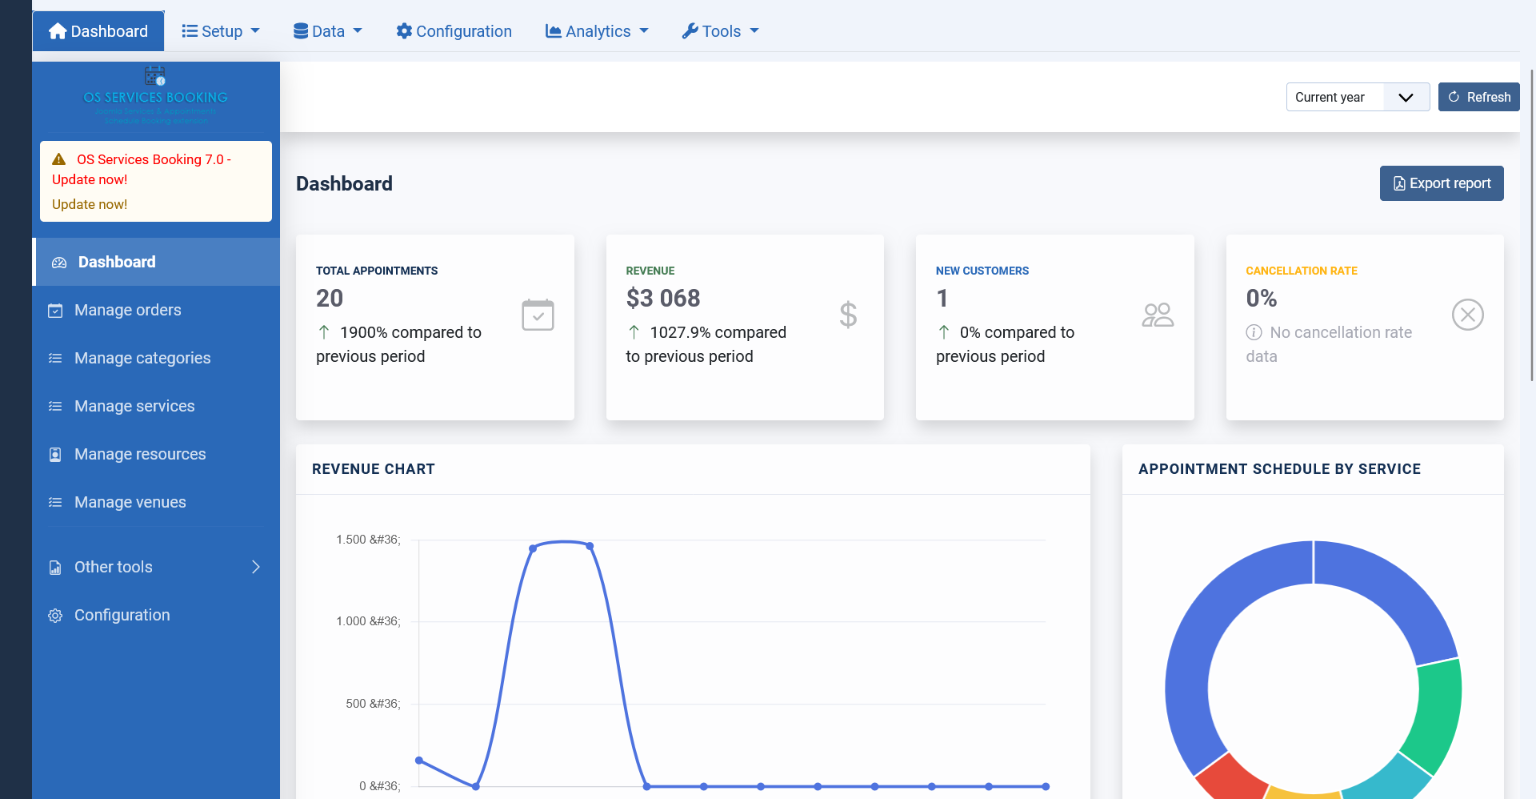
OS Services Booking — Dashboard: Your Business at a Glance
See Everything. Decide Faster. Grow Smarter.
Running a service business means juggling appointments, tracking revenue, managing staff, and keeping customers happy — all at the same time. The OS Services Booking Dashboard puts every important number and trend right in front of you the moment you log in.
No complicated reports. No digging through spreadsheets. Just a clean, clear overview that tells you exactly how your business is doing — right now.
What Is the Dashboard?
The Dashboard is the home screen of the OS Services Booking backend. It is the first thing administrators and managers see after logging in. It is designed to give you a complete picture of your business in seconds.
From the Dashboard you can:
- See your most important business numbers at a glance
- Spot trends over time with easy-to-read charts
- Review upcoming appointments without searching
- Track what your team is doing
- Export a professional report in one click
Key Features
1. Four Essential KPIs — Always Visible
At the top of the Dashboard, four summary cards show you the numbers that matter most:
| Card | What It Shows |
|---|---|
| Total Appointments | How many bookings were made in the selected period |
| Revenue | Total income earned from completed bookings |
| New Customers | How many first-time customers booked with you |
| Cancellation Rate | The percentage of bookings that were cancelled |
Each card also shows a comparison to the previous period — so you instantly know whether things are going up or down. A green upward arrow means growth. You do not need to calculate anything yourself.
Example: You select "This Month." The Revenue card shows $3,068 and tells you it is up 1,027% compared to last month. One number. One glance. Done.
2. Revenue Chart — See Your Income Over Time
The Revenue Chart is a smooth line chart that visualizes your income across the period you choose.
- Today or Yesterday: See revenue broken down by hour
- This Week: See revenue day by day
- This Month: See revenue week by week
- This Quarter or Year: See revenue month by month
Hover over any point on the chart to see the exact amount. Change the time filter at any time to instantly switch between different views of your revenue history.
This chart helps you answer questions like:
- "Which day of the week do we earn the most?"
- "Did the promotion we ran last month actually work?"
- "Is our busy season starting earlier this year?"
3. Appointments by Service — Know What Sells
Beside the Revenue Chart is a doughnut chart that shows which of your services are most popular. It displays the top five services by number of bookings, with all remaining services grouped under "Other."
Each slice of the chart is a different color, with a legend below showing the service name and percentage. You can see at a glance:
- Which service drives the most bookings
- Whether your business depends too much on one service
- Which services might need better promotion
4. Flexible Time Filters
All data on the Dashboard updates based on the time period you select. There are six options:
- Today — Just today's data
- Yesterday — Yesterday's data for comparison
- This Week — Monday through Sunday of the current week
- This Month — From the 1st to the last day of the current month
- This Quarter — The current calendar quarter
- This Year — January 1 through December 31 of the current year
Switch between them using the dropdown in the top-right corner. Click Refresh to reload the latest data at any time.
5. Upcoming Appointments — Never Miss a Booking
Below the charts, a table shows the next five upcoming appointments. For each booking you can see:
- Order ID — The booking reference number
- Customer Name — Who made the booking
- Service — What service was booked
- Employee — Which staff member is assigned
- Venue — Where the appointment takes place
- Date and Time — When it is scheduled
- Status — Pending, Completed, Attended, or Cancelled (shown with color badges)
- Edit Button — Jump directly to the full booking record to make changes
This section is perfect for a quick morning review before the day begins.
6. Recent Activity Feed — Know What Changed
Requirement: This feature requires the Joomla Action Log plugin (
com_osservicesbooking) to be enabled. You can activate it under Joomla → System → Plugins.
The Activity Feed shows the last five actions taken in the system, such as:
- 📅 A new booking was created
- ✅ A booking was updated or confirmed
- ❌ A booking was cancelled
- 💰 A payment was received
- 👤 A new customer registered
Each activity entry shows the action type, a brief description, and the time it happened. This is especially useful for multi-staff businesses where multiple people have backend access.
7. Export Report — Share Data Professionally
The Export Report button in the top-right corner of the Dashboard generates a complete PDF report for the selected time period. The report includes:
- All four KPI statistics (appointments, revenue, customers, cancellation rate)
- Revenue breakdown by service — with percentages and booking counts
- Appointment distribution by service, employee, and venue
- Payment statistics (partial, full, refunded)
- Booking status breakdown (pending, cancelled, completed)
- Chart images are captured and embedded directly in the PDF
The report is generated automatically and downloads to your computer in seconds. It is ready to share with business partners, present in meetings, or file for records — no formatting required.
8. Getting Started Guide — For New Installations
If you have just installed OS Services Booking and have not set up any services or received any bookings yet, the Dashboard shows a friendly Getting Started guide. It walks you through three simple steps:
- Set Up Your Services — Add the services your business offers
- Set Up Your Employees — Add your staff members
- Set Up Working Hours — Configure when bookings are available
Quick tips are also shown for adding the booking module to your Joomla site, setting up email templates, and using custom fields. Each tip links directly to the relevant settings page.
Why the Dashboard Matters
Here is what the Dashboard helps you do every day:
| Without Dashboard | With Dashboard |
|---|---|
| Open multiple reports to get basic numbers | See all key numbers on one screen |
| Calculate trends manually | Trends shown automatically with indicators |
| Check bookings one by one | See next 5 bookings in one table |
| Prepare reports manually for meetings | Click one button to export a PDF report |
| Guess which services are popular | See an instant chart of top services |
Simple. Powerful. Always Available.
The OS Services Booking Dashboard is designed for business owners, managers, and administrators who want to stay informed without spending time digging through data. Whether you run a salon, a clinic, a training studio, or any other appointment-based business, the Dashboard keeps you in control.
- ✅ No technical knowledge required
- ✅ Works on any screen size
- ✅ Updates in real time with one click
- ✅ Covers all the numbers you need to run your business
- ✅ Export reports instantly for meetings or records
Get Started Today
The Dashboard is included in every installation of OS Services Booking for Joomla. There is nothing extra to configure — simply install the component, log in to your Joomla backend, and your Dashboard is ready.